Your data or question
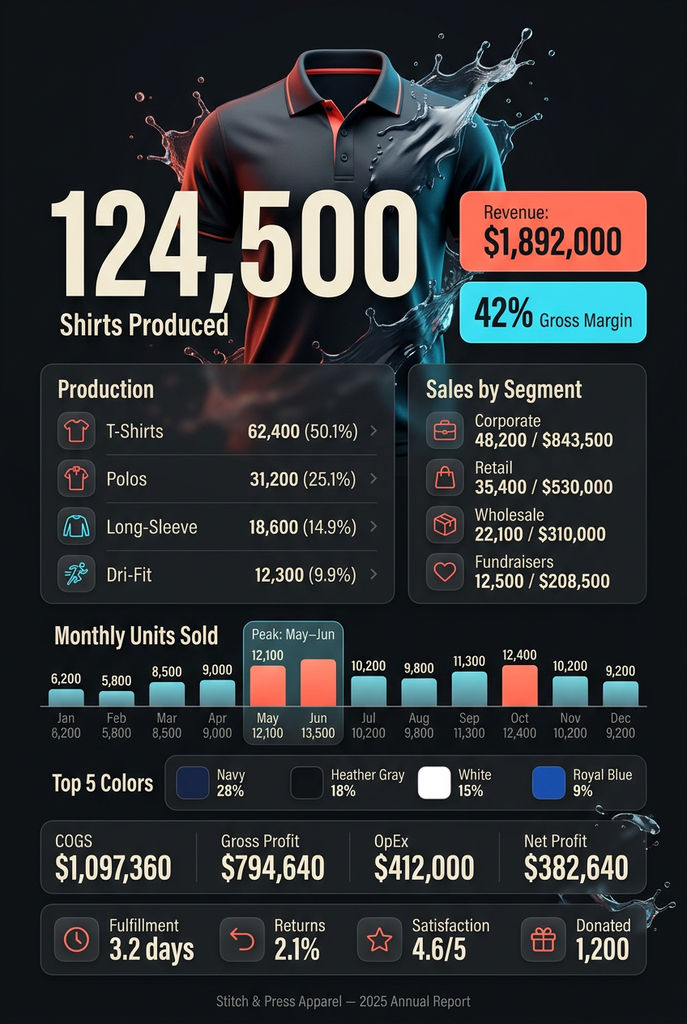
🧢 Company: Stitch & Press Apparel Report Period: January 1 – December 31, 2025 Prepared for: Annual Leadership Presentation 📊 1. Executive Summary Total shirts produced: 124,500 Total shirts sold: 118,200 Revenue: $1,892,000 Gross profit margin: 42% Top-selling category: Custom corporate event shirts 👕 2. Production Breakdown (by shirt type) Type Units Produced % of Total T-Shirts 62,400 50.1% Polo Shirts 31,200 25.1% Long-Sleeve 18,600 14.9% Performance/Dri-Fit 12,300 9.9% 📈 3. Sales by Customer Segment Segment Units Sold Revenue ($) Corporate events 48,200 $843,500 Retail (online store) 35,400 $530,000 Wholesale (other shops) 22,100 $310,000 Fundraisers / non-profits 12,500 $208,500 🎨 4. Top 5 Colors Ordered Navy – 28% Black – 24% Heather Gray – 18% White – 15% Royal Blue – 9% 📅 5. Monthly Performance Snapshot (Units Sold) Month Units Sold Jan 6,200 Feb 5,800 Mar 8,500 Apr 9,000 May 12,100 Jun 13,500 Jul 10,200 Aug 9,800 Sep 11,300 Oct 12,400 Nov 10,200 Dec 9,200 📌 Peak season: May–June (corporate events & team building) 🧾 6. Financial Summary Item Amount ($) Total Revenue 1,892,000 Cost of Goods Sold (COGS) 1,097,360 Gross Profit 794,640 Operating Expenses 412,000 Net Profit 382,640 🚚 7. Operational Metrics Average order fulfillment time: 3.2 days Return rate: 2.1% (mostly sizing issues) Customer satisfaction score (survey): 4.6 / 5 Shirts donated (defects/samples): 1,200 🎯 8. Key Takeaways & Recommendations ✅ What worked well: Corporate bulk orders drove majority of revenue Online store grew 18% vs last year Dri-Fit shirts gaining popularity ⚠️ Areas to improve: Long-sleeve shirts underperformed (only 15% of sales) November–December slower than expected → need holiday campaign 🔜 2026 Focus: Expand performance shirt line Add embroidery option for premium polos Launch referral program for corporate clients
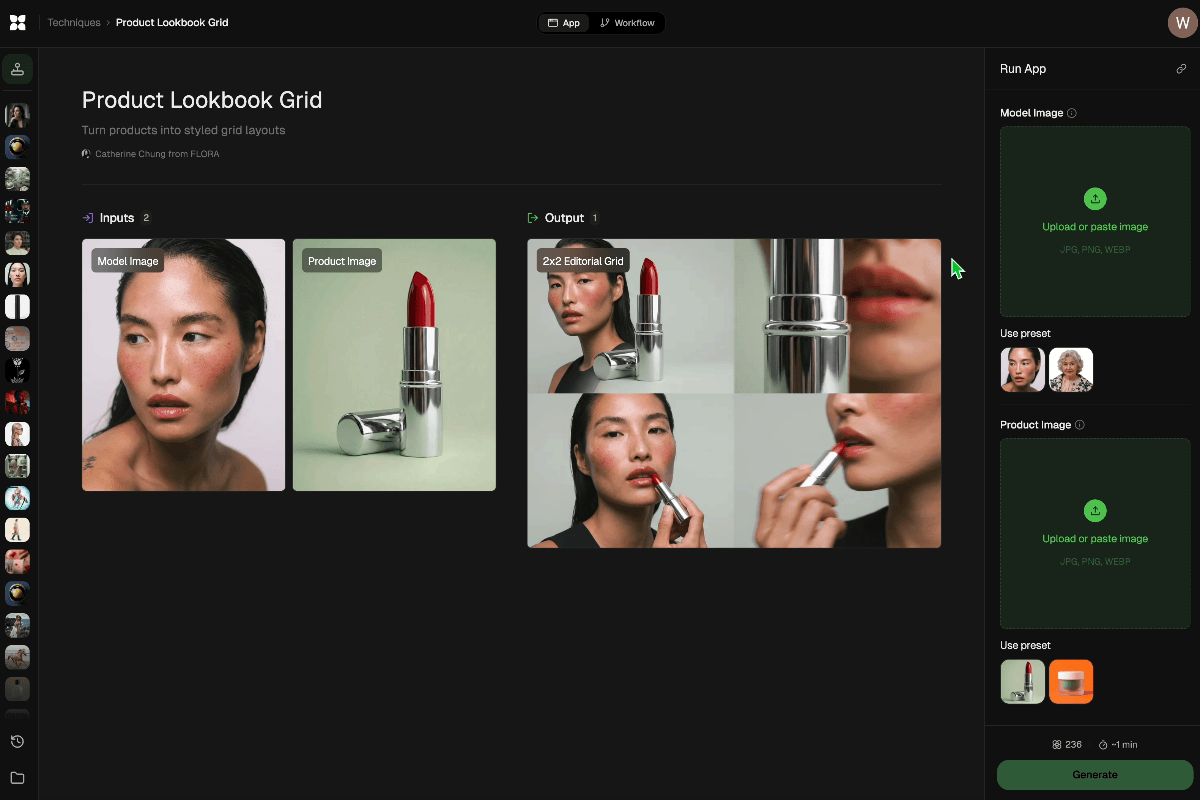
Run this AI-powered technique in your browser. Upload your inputs, hit generate, and get professional results in moments.

Creative Production
Design teams use FLORA techniques to produce professional-quality creative assets in seconds, accelerating production timelines and reducing dependency on manual editing.

Marketing Content
Marketing teams generate on-brand visual content for campaigns, social media, and ads — iterating quickly on concepts without waiting for design resources.

Product Visualization
E-commerce and product teams create high-quality product visuals, mockups, and lifestyle imagery to showcase their offerings across channels.
How to use Techniques?
Discover how to utilize Data Artwork for different scenarios.
Add inputs
Upload images, videos, or type in the prompts to get started.
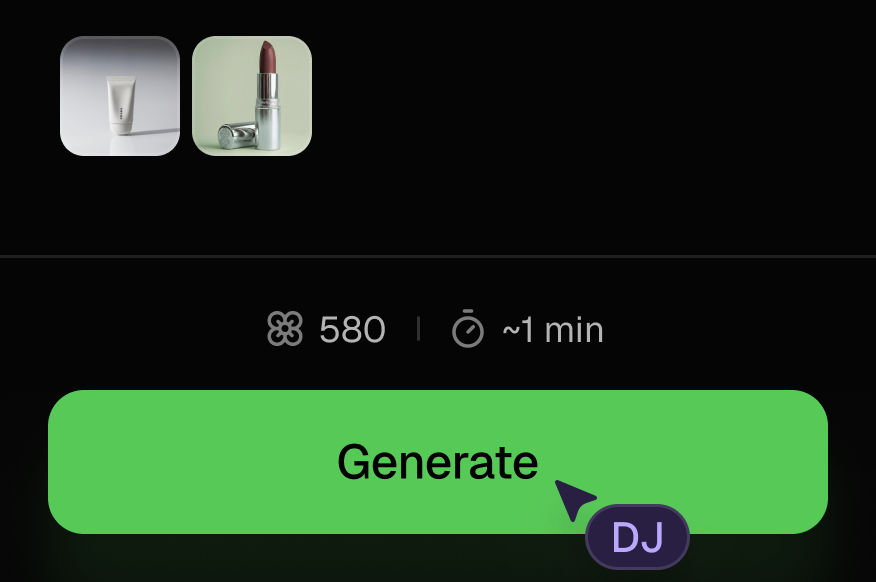
Generate outputs
Next, hit the "Generate" button to start generating your outputs.
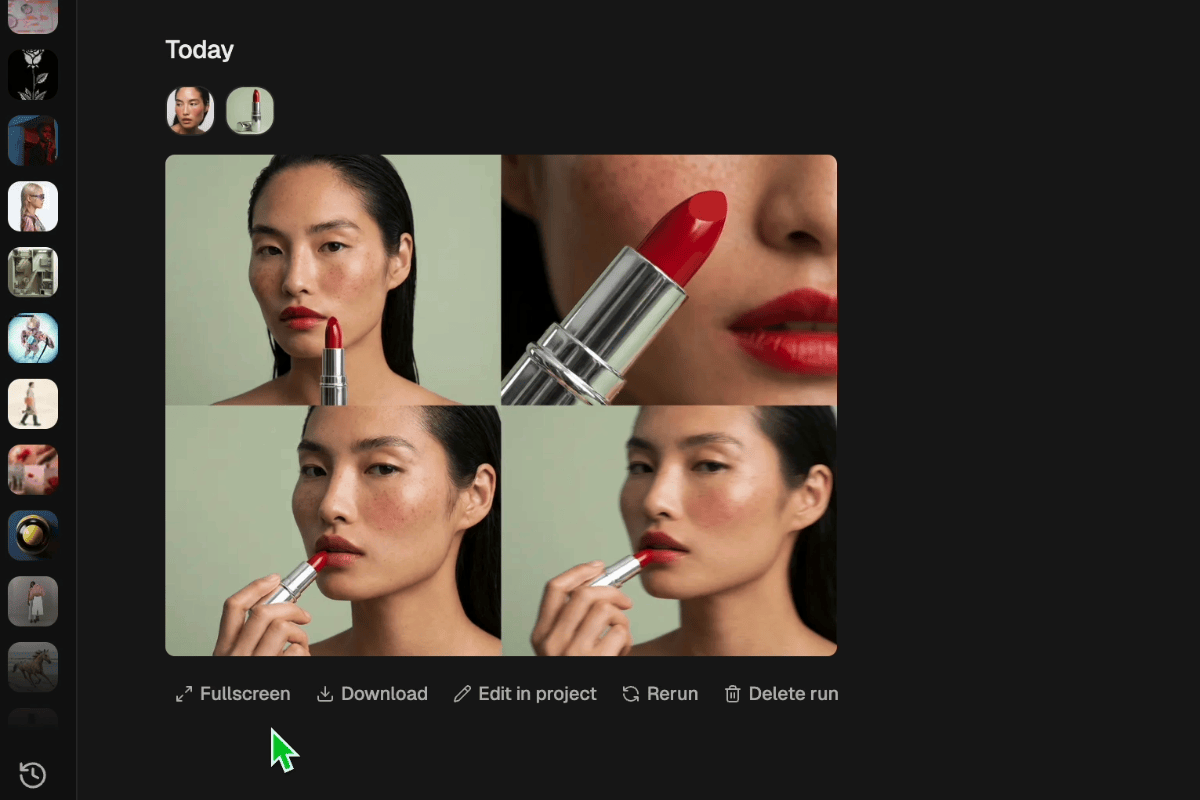
Edit and export
Refine your outputs on canvas, or download them directly.
Frequently asked questions
All you need to know about Data Artwork
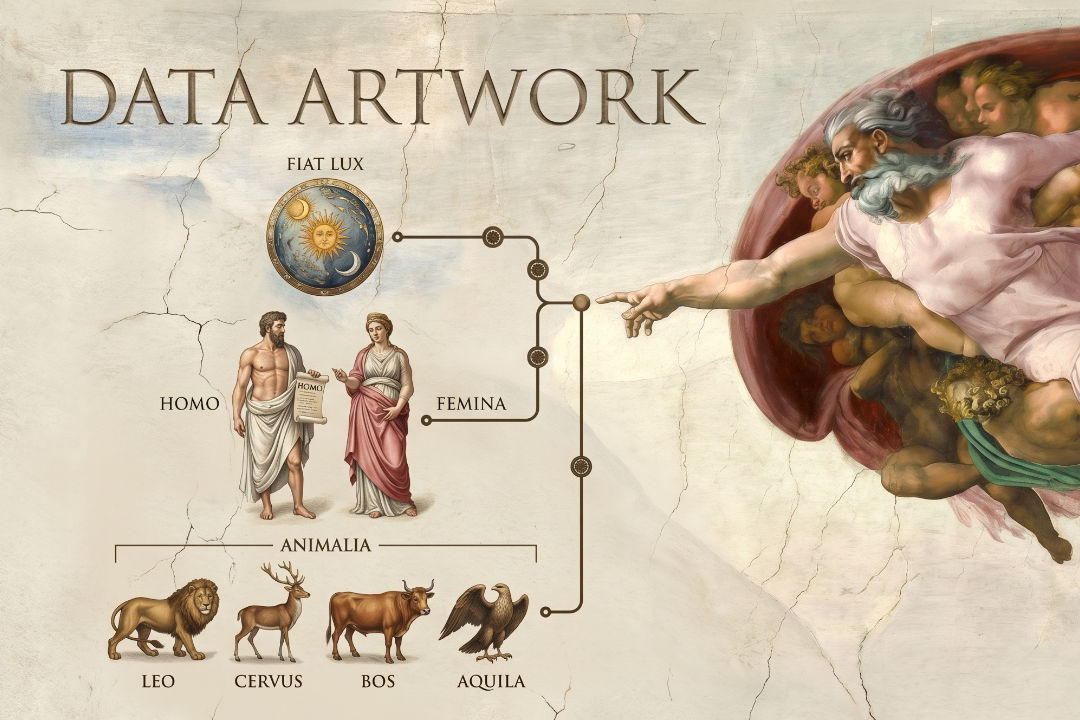
Data Artwork
Make your data beautiful. This is a smart technique that turns any data you input into a beautiful well organized presentation of that very same data.

Andres Felipe